
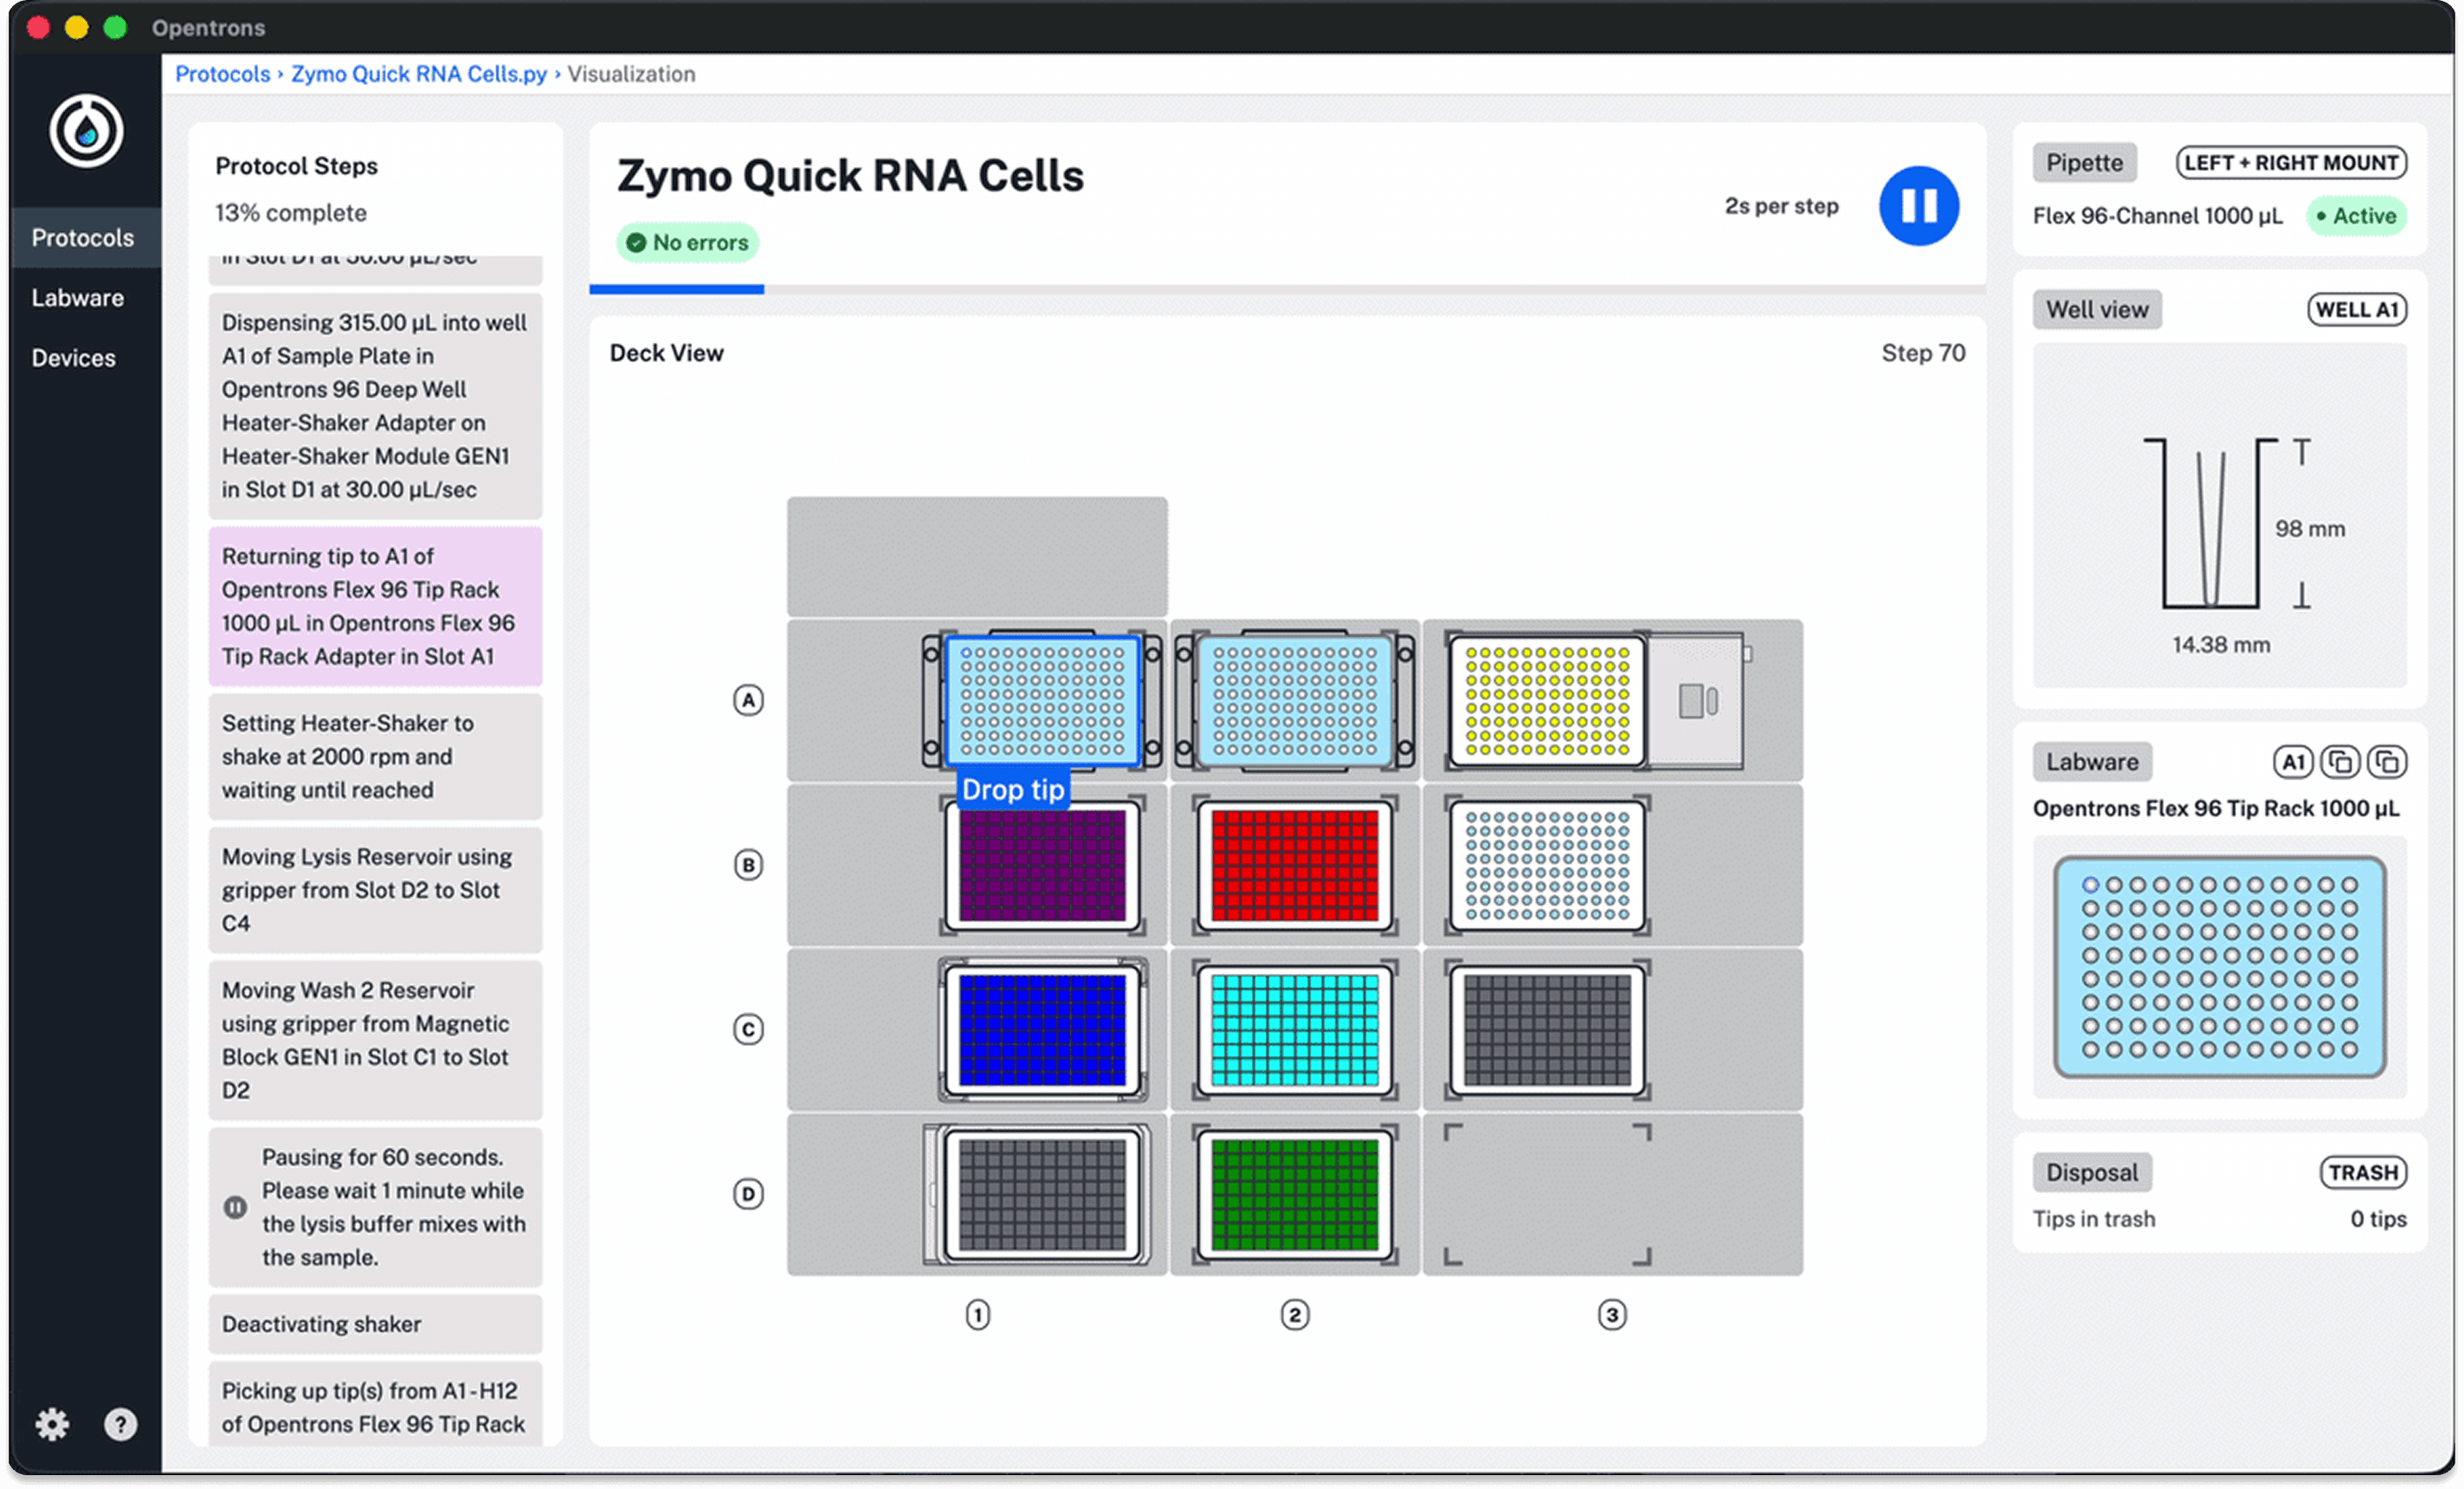
Protocol Visualization introduces a new way for scientists to understand automated lab workflows by transforming coded protocols into an interactive visual representation of the robot deck. This feature displays how liquids, labware, and modules change over time, enabling users to preview and test protocol logic before running test runs.
I helped define the product direction and led the design for Opentrons' first data visualization surface, supporting both Python-based protocol authors and GUI-based users. The system improves protocol validation, reduces trial-and-error experimentation, and establishes a foundation for future AI-assisted protocol generation.
Role
Lead Product Designer
Launch
April 2026
Project Considerations
Protocol visualization started as an abstract concept, requiring me to define both the problem space and product direction. I partnered on early user research to understand how scientists move from authoring to executing protocols, and used those insights to introduce key features to the PRD that made complex workflows more readable.
These features circled around how we could translate thousands of code-generated steps into an interface that supports both a high-level understanding and detailed investigation without overwhelming the user.
Questions I considered:
- How can we help users track changes over time across liquids, labware, and modules?
- How can we reduce cognitive load while still supporting deep investigation and debugging?
- What levels of abstraction could we introduce that help tell a story of what this protocol does?
- What information is most useful to the user to help them easily debug errors?